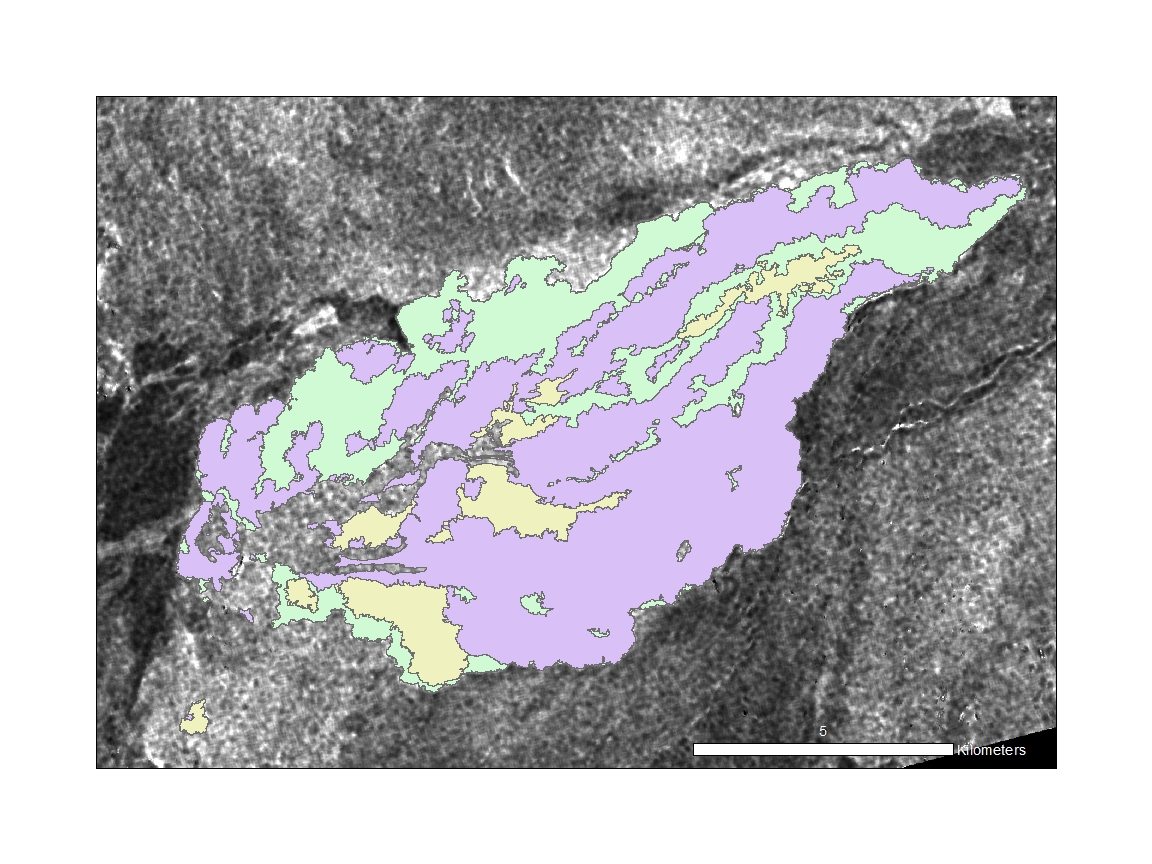
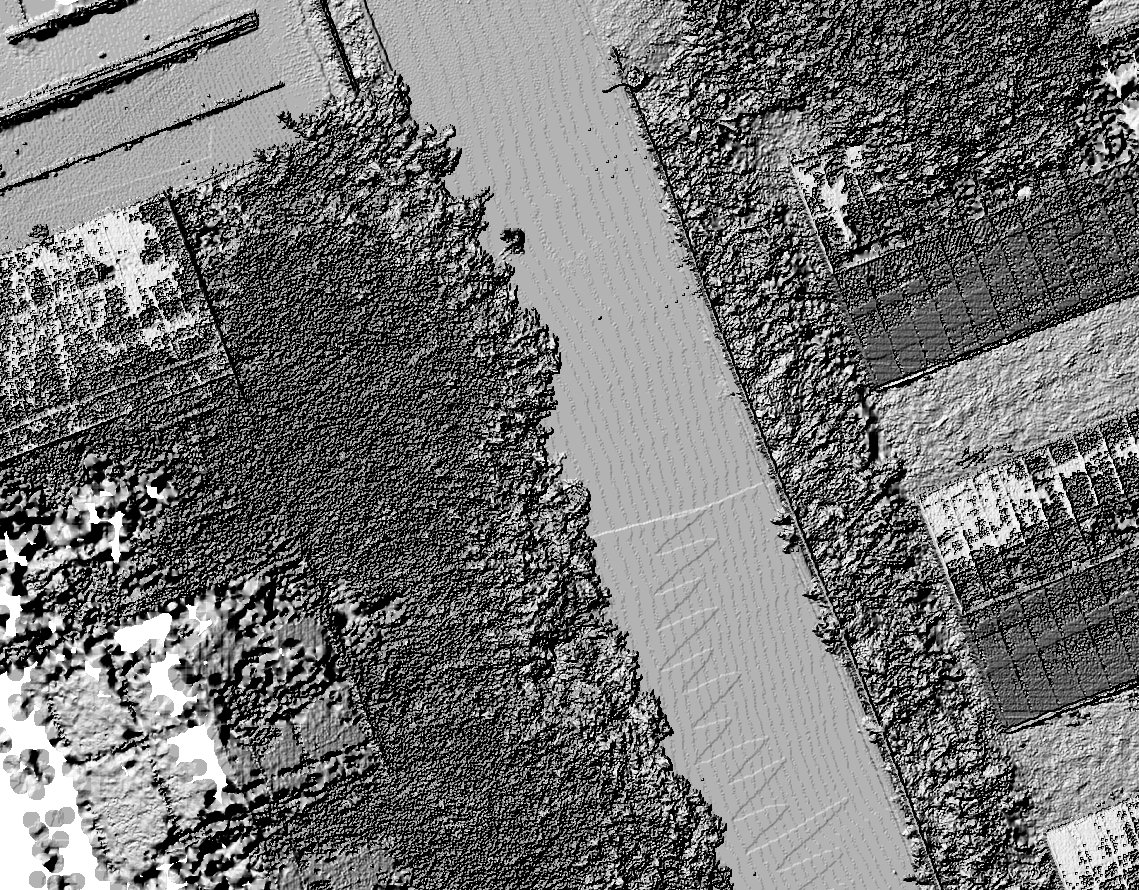
Very generally, the initial thrust of my research is concerned with environments on the Earth that can serve as analogues for planetary surfaces, such as the Moon and Mars. In particular, Catherine and I are interested in characterizing terrestrial lava flow-fields as planetary analogues, building off of previous work done in this area. For my first semester, I worked on analyzing Sentinel-1 radar images of the Holuhraun lava flow-field in Iceland, which erupted for almost six straight months from August 2014 to February 2015. The Holuhraun lava flow-field is a product of a fissure-fed eruption, which can serve as an excellent analogue for the many other examples of fissure volcanism we find elsewhere in the solar system. Previous work, including mapping by Voigt et al. (2021a) and analysis by Tolometti et al. (2021), looked at some of the different facies in the Holuhraun lava flow-field. Different lava facies in the same flow-field can be signs of variations in magma composition, effusion rate, and/or lava transportation, which affect how the lava ends up being emplaced. The different lava facies at Holuhraun allow us to determine which of these factors were most significant in producing the flow-field we see today, which can help us better understand volcanism on other planetary surfaces. Tolometti et al. (2021) examined three different major facies of the Holuhraun lava flow-field, finding that the "spiny" facies is separable, or distinct from the "rubbly" and "undifferentiated rubbly-spiny" facies when comparing radar backscatter values to surface roughness gleaned from high-resolution topography.
Some questions I've been thinking about: how (if at all) do the radar backscatter values of the Holuhraun lava flow-field facies change over time? Do the spiny facies remain distinct from the rubbly and undifferentiated facies, or do certain factors (such as weathering, erosion, or aeolian deposition) affect what can be detected by radar? To try and answer this, I extracted radar backscatter values (VH, VV, and VH/VV-- two different radar polarizations, as well as a ratio of those two polarizations) from 29 Sentinel-1 observations of Holuhraun, compiled by my labmate Anthony Dicecca. Through a sometimes frustrating and time-consuming workflow, I was able to produce average radar backscatter values for each facies for all observations.
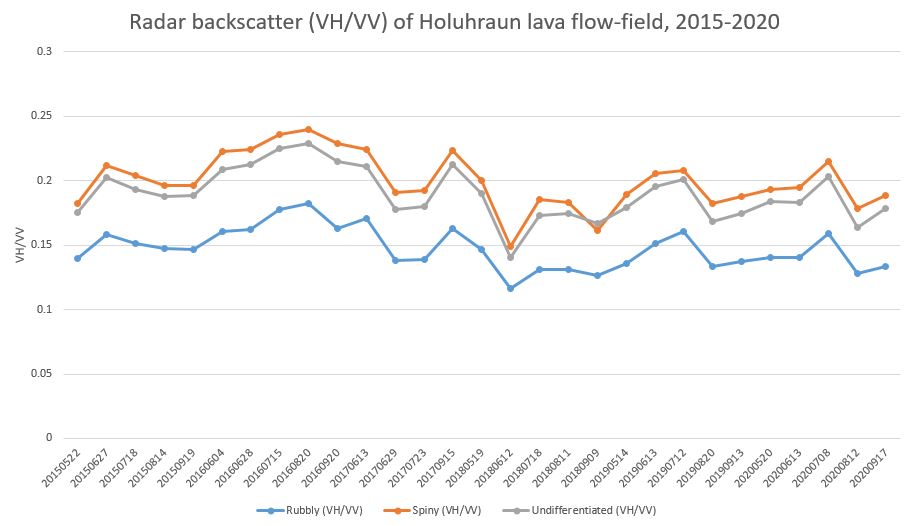
There's still a lot that needs to be done with this data-- calculating error, seeing if the statistical trends observed by Tolometti et al. (2021) hold over time, and thinking about what this all means. Next, I want to talk about the other aspect of my research that I worked on this semester.
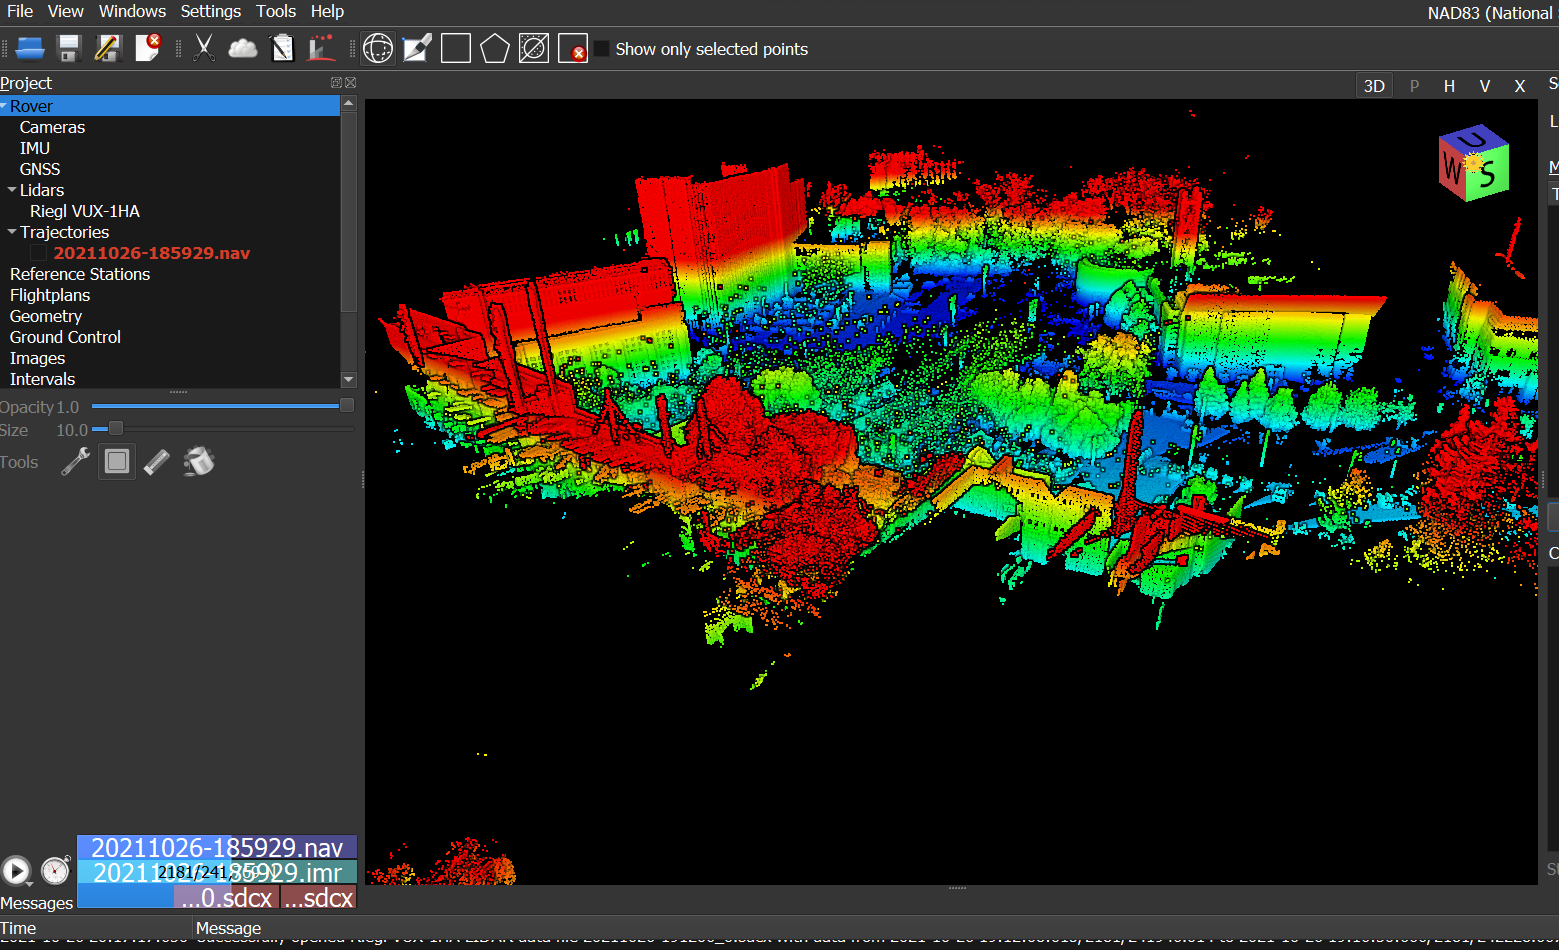
I mentioned that previous work compared radar values with surface roughness-- well, barring the absence of additional COVID variants, myself and others will be in Iceland next summer, traipsing around the very same lava flow-field that I just mentioned. This semester Catherine obtained a very expensive backpack LiDAR, and I've spent a bit of the last couple months either in various trainings or out walking around campus collecting initial data. The two trainings were respectively focused on data acquisition, or actually collecting data with the LiDAR system, and post-processing, or how to turn the collected data into a form that we can use to answer questions about planetary topography. After a couple failed attempts, on our third scanning run with the backpack LiDAR myself, Catherine, and Gavin Tolometti were able to produce a point cloud of (part of) the Western campus!
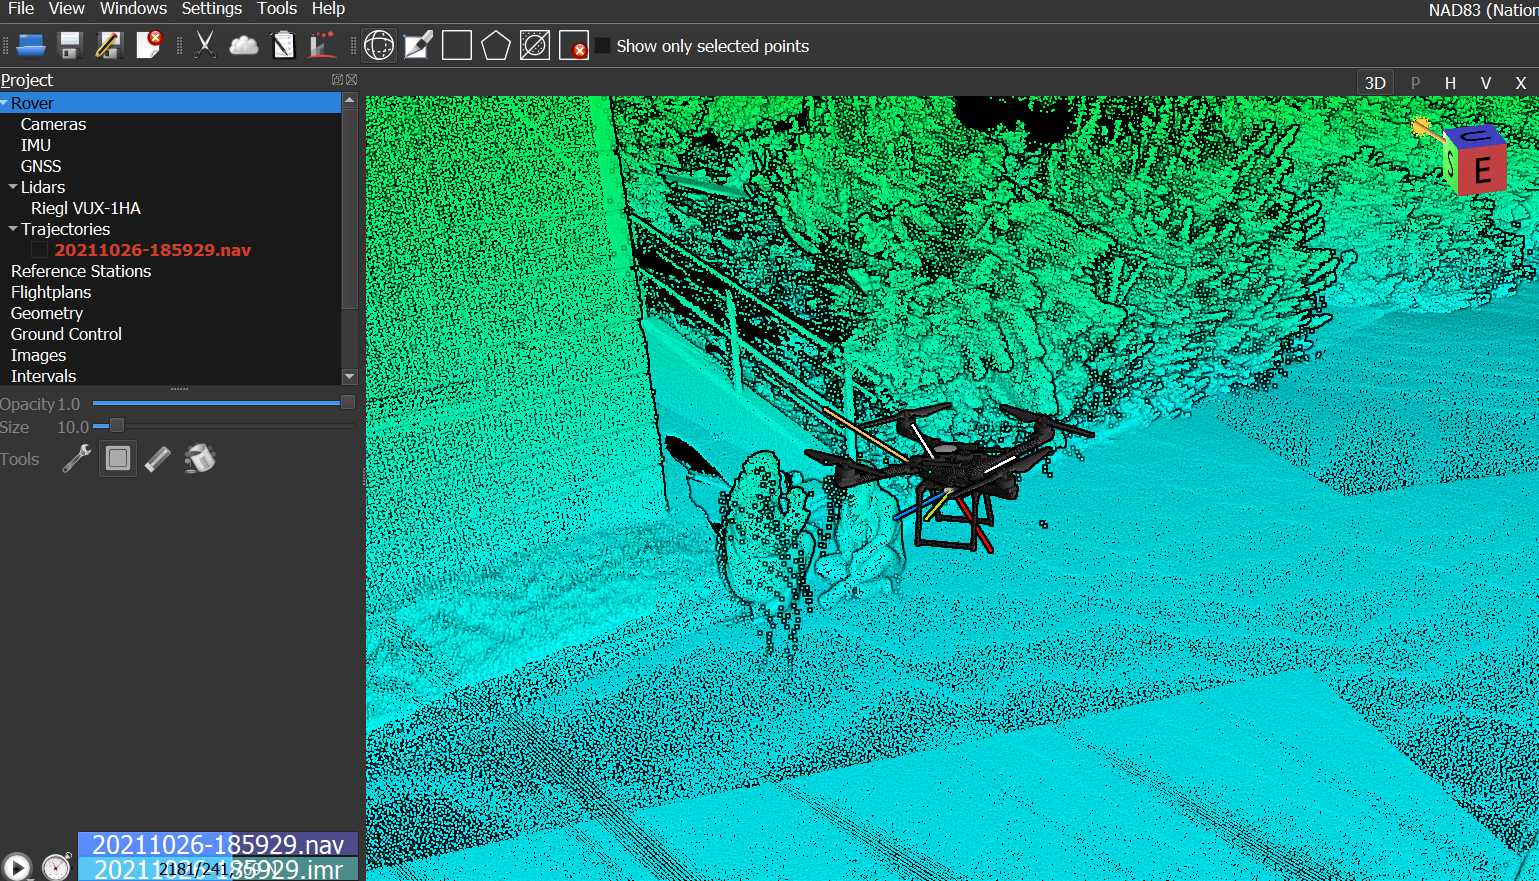
A month later, Catherine and I underwent training in how to actually take the point cloud and navigation data and produce something useful for our scientific questions, like a digital elevation model (DEM). This workflow had us going between multiple different software platforms, and I still need to take further notes on the training recording and get a lot more practice working the software, but at the end of the day we had a DEM! This is something that we'll want to produce when we take the backpack LiDAR to Iceland next year-- a high-resolution topographic map of our study area that'll help us better characterize the surface roughness of planetary analogue lava flows.
While I'm excited that I've got a pretty okay handle on the methods and some of the initial questions of my research, there were still quite a few challenges that came up this semester. One of which was the question of how to best expedite an image processing workflow. As you can see below, between the ESA's SNAP software and ArcMap, I had a number of steps I needed to make sure were fulfilled to create usable images I could extract radar backscatter values from.
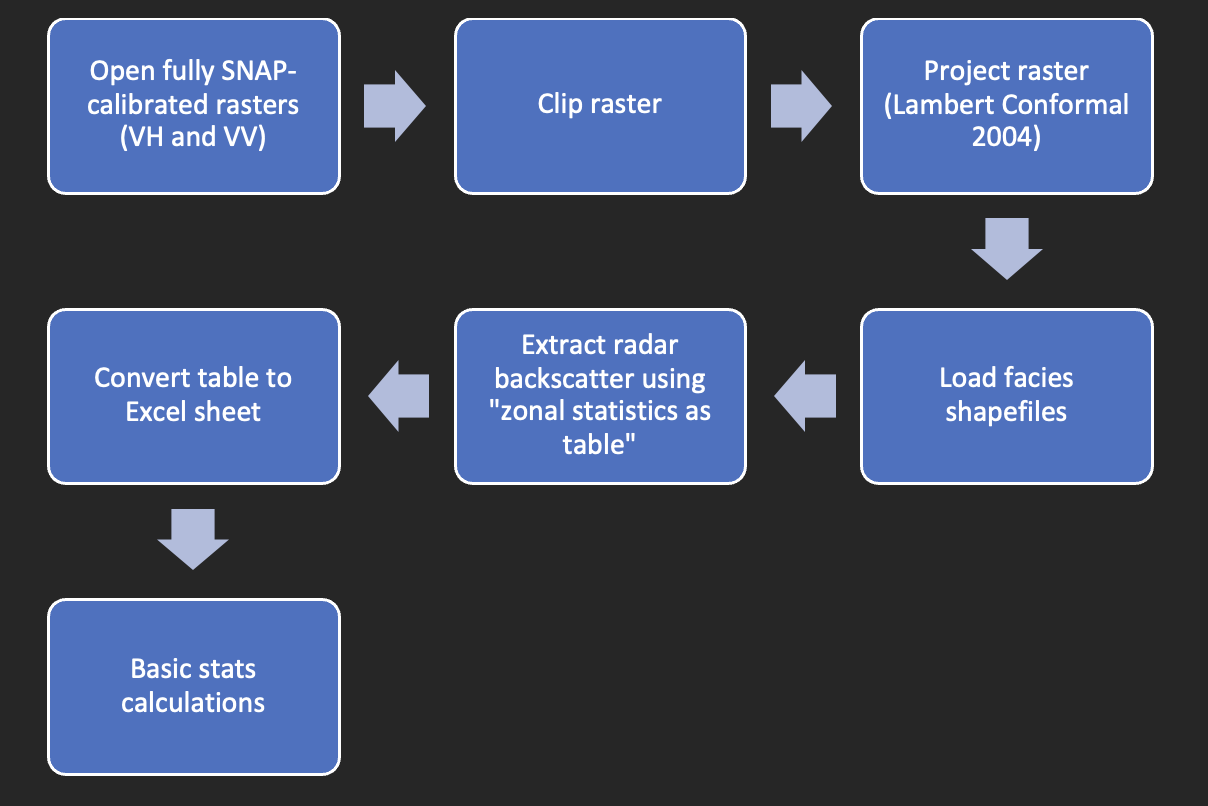
The question is… was there a better way to accomplish this same workflow? Ideally, I'd like to automate as much of this as possible, as each of the 29 observations took about 1-2 hours from data download to getting my results. This likely requires more programming skills than I currently have, so stay tuned to find out if I'm able to better expedite the process when faced with another workflow like this one!
The last challenge is directly relevant to why I'm here: asking questions. Between multiple courses and assignments due, my TA workload, and the data collection and training aspect of research, it can sometimes be difficult to find space in the day to just think. Next semester, I definitely need to cordon off more time to try and think of relevant questions, as well as go through the literature-- something that became much more difficult as the semester progressed. After a first few months here at Western, what have I learned? I'll end with a couple lessons I've learned that someone reading this might find helpful. Like I mentioned above, with all the various duties you have as a grad student, there's never going to be enough time in the day to completely clear-out your to-do list. Maybe the lesson is you have to okay with not getting everything done, for two reasons. 1) you're not getting paid enough! And 2) as a planetary scientist, your job is to make some sense out of the mountains of data that've been collected on dozens of different planetary bodies, including our own. There will always be more questions and more data to try and help answer those questions then there are hours in the day. It's okay if you don't get to everything.
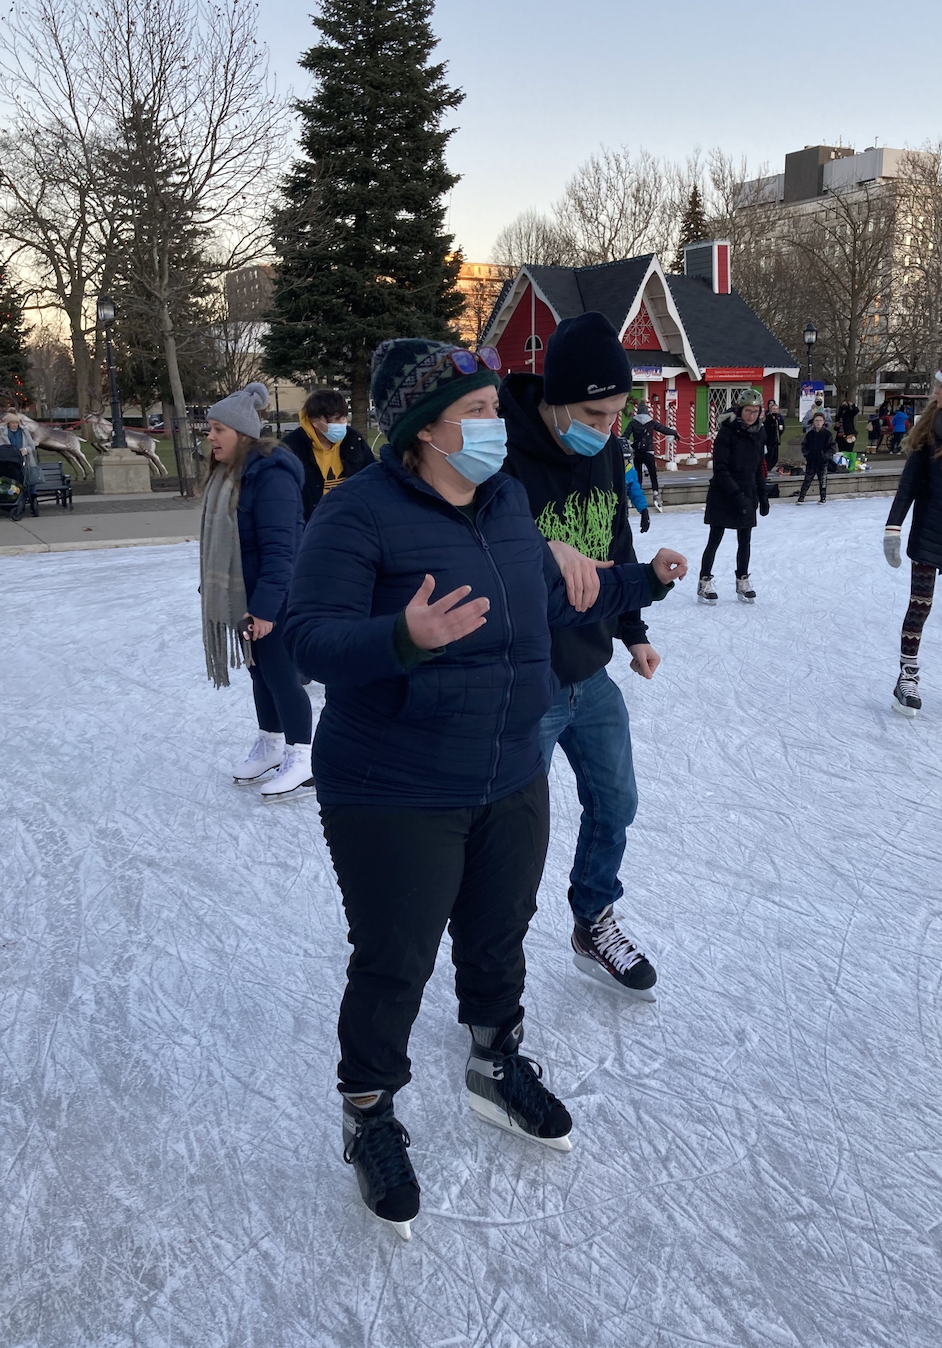
Lastly, I think the above image really sums up an important lesson. You're in grad school. Your job is to learn new things. I learned basic HTML to write this blog post! Maybe those things might seem kinda scary. Maybe you're scared you'll (hypothetically) fall down. Maybe you're scared all the (hypothetical) teens at the (hypothetical) ice rink will (hypothetically) laugh at you. It's a good idea to ask for help! I know that I would've had a rougher time this semester had I not asked for and received help from my labmates and peers. Thanks for reading this, and I'll see you in the new year!