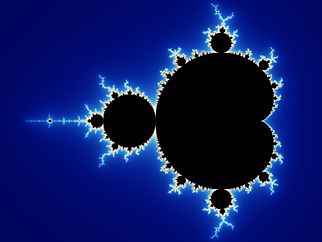
The above image is one that you've probably seen by now. It's called the Mandelbrot Set, a visualization made by mathematician Benoit Mandelbrot of thousands of calculations of the same equation. As there are so many calculations involved in producing this visualization, it was only discovered with the advent of the personal computer in 1980. Some of the math involved goes a bit over my head, but I'll try to explain it the best I can. The equation Mandelbrot used and was interested in can be written as Zn+1 = Z^2n + C Where "Z" and "C" are both complex numbers, meaning that they're not just numbers on a line, like what we're most comfortable thinking about-- they're numbers in a two-dimensional plane. Z can be written as Z = x + yi, where x and y are the coordinates on a two-dimensional plane and ii is an imaginary number, where i^2 is equal to -1. Mandelbrot was interested in taking this equation and starting Zn at 0, and just changing the value for C. This means that C becomes the second value of Zn+1, which is then squared in the next iteration of the equation. So if Mandelbrot was starting with Zn at 0, the value of C becomes very important. What happens if you square 1. You get 1. What happens if you square a number greater than 1? What happens when you square that number? And the number after that? Well, you start making some really big numbers. Keep on iterating through the equation and you can even get to infinity, if you're very patient. But what happens if C is less than 1? What happens if you square that? You start making some very small numbers. Eventually, you get close to 0. With the computational abilities of the time, Mandelbrot essentially "mapped out" where on a two-dimensional plane the results of his function went to infinity, and where the results went to 0, which he termed "unstable" and "stable," respectively.
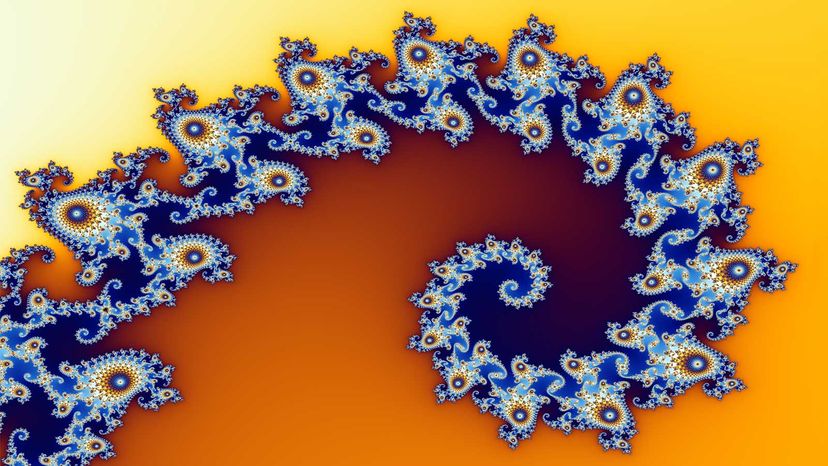
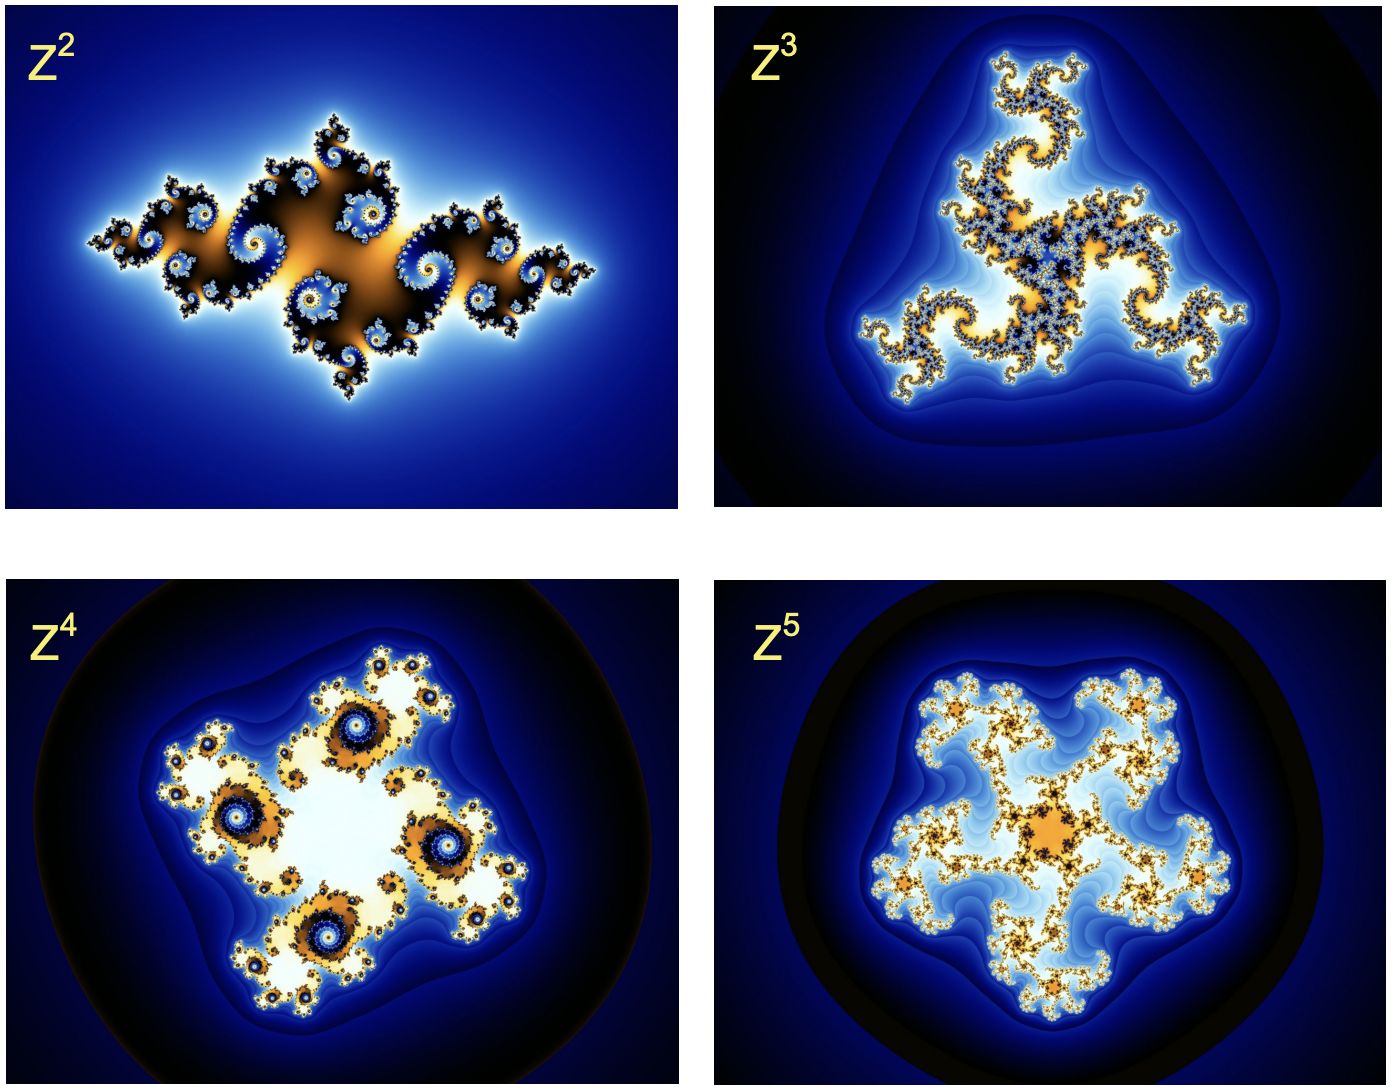
Everywhere you see on the Mandelbrot Set visualization that's black is a "stable" result (where the result is close to 0) and all the colored margins are where the result is "unstable" (where the result goes to infinity), with the location determined by the value of C. If you want to kill a few hours, you can find some visualizations online that zoom all the way in on the "unstable" portions of the Mandelbrot Set. These are the sections very clearly show a fractal nature, i.e. they comprised of repeating patterns that are the same at any scale. As you zoom in, you'll notice the colors of the "unstable" regions changing very quickly. This is showing you how much of a factor even a slight change in the value of C-- it can lead to big changes! Speaking of changes, what happens if you change the exponent in Zn+1 = Z^2n + C to a 3, or a 4, or 5? The resulting class of fractals is called a Julia Set.
Another type of fractal is a geometric fractal. As the name implies, geometric fractals are formed from by repetitions in a simple geometric process. Two well-known geometric fractals are Sierpenski Triangles, which are formed by removing a triangle from the center of the earlier generation of triangles, and the Koch Curve (also known as the Koch Snowflake). The Koch Curve is developed by taking a line segment, adding a shape (such as a triangle) to the center of the line segment, and then repeating the same processes to each successive line segment formed. What's interesting is that with each subsequent generation of a Koch Curve, your initial shape gains a greater length. This is similar to the fractal nature of coastlines, which I'll talk about in a second.
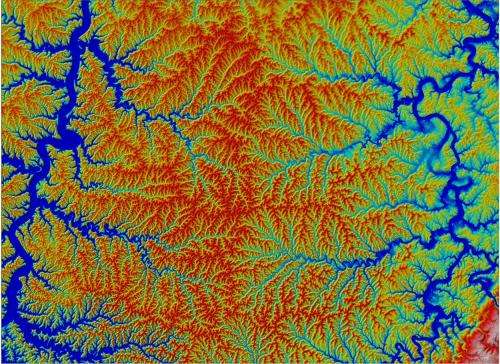
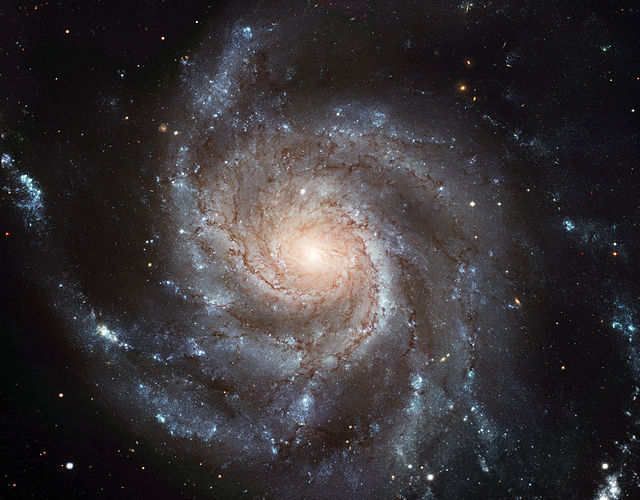
The last type of fractal I'd like to talk about is a natural fractal. You've likely seen many examples of these types of fractals, even if you haven't been fully aware you were looking at a fractal. Different examples of natural fractals include: Trees! River networks! Spiral galaxies! Hurricanes! Coastlines!
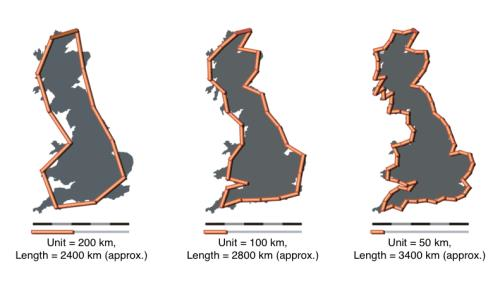
I want to discuss the last natural fractal I mentioned-- coastlines. In 1967, Benoit Mandelbrot published a paper in Science entitled "How Long is the Coast of Britain? Statistical Self-Similarity and Fractional Dimension." This was before he even coined the term fractals, but in this paper he examined the issue of measuring a coastline. If you think back to Calc I, you'll probably recall that to accurately measure the length of a curve it's far better to have more numerous, small line segments than it is to have longer and fewer ones. Mandelbrot speculated that if you were to measure a coastline with near-infinite resolution, the total length of the coastline would approach infinity-- you have the natural bays and promontories of a coast, which continue to smaller and smaller scales all the way down to grains of sand. This is a really interesting question, and one that past members of this group have worked on in the context of lava flows! Dr. Ethan Schaefer, a recent postdoc in the Neish Lab, has done some work on examining the fractal nature of the margins of lava flows. Bruno et al. (1994) was one of the first to look at the fractal dimension of lava flow margins, finding that a'a and pahoehoe flows could actually be distinguished by a fractal analysis of their flow margins, which in turn says something about their rheology and emplacement. In Schaefer et al. (2021), the authors looked at the Holuhraun lava flow-field in Iceland using Sentinel 1 radar imagery. As I'm also looking at Sentinel 1 images of Holuhraun taken over several years, I think it'd be interesting to see how the fractal nature of the lava flow margins at Holuhraun may be affected by increased sedimentation. What will I find? Who knows! Stay tuned!