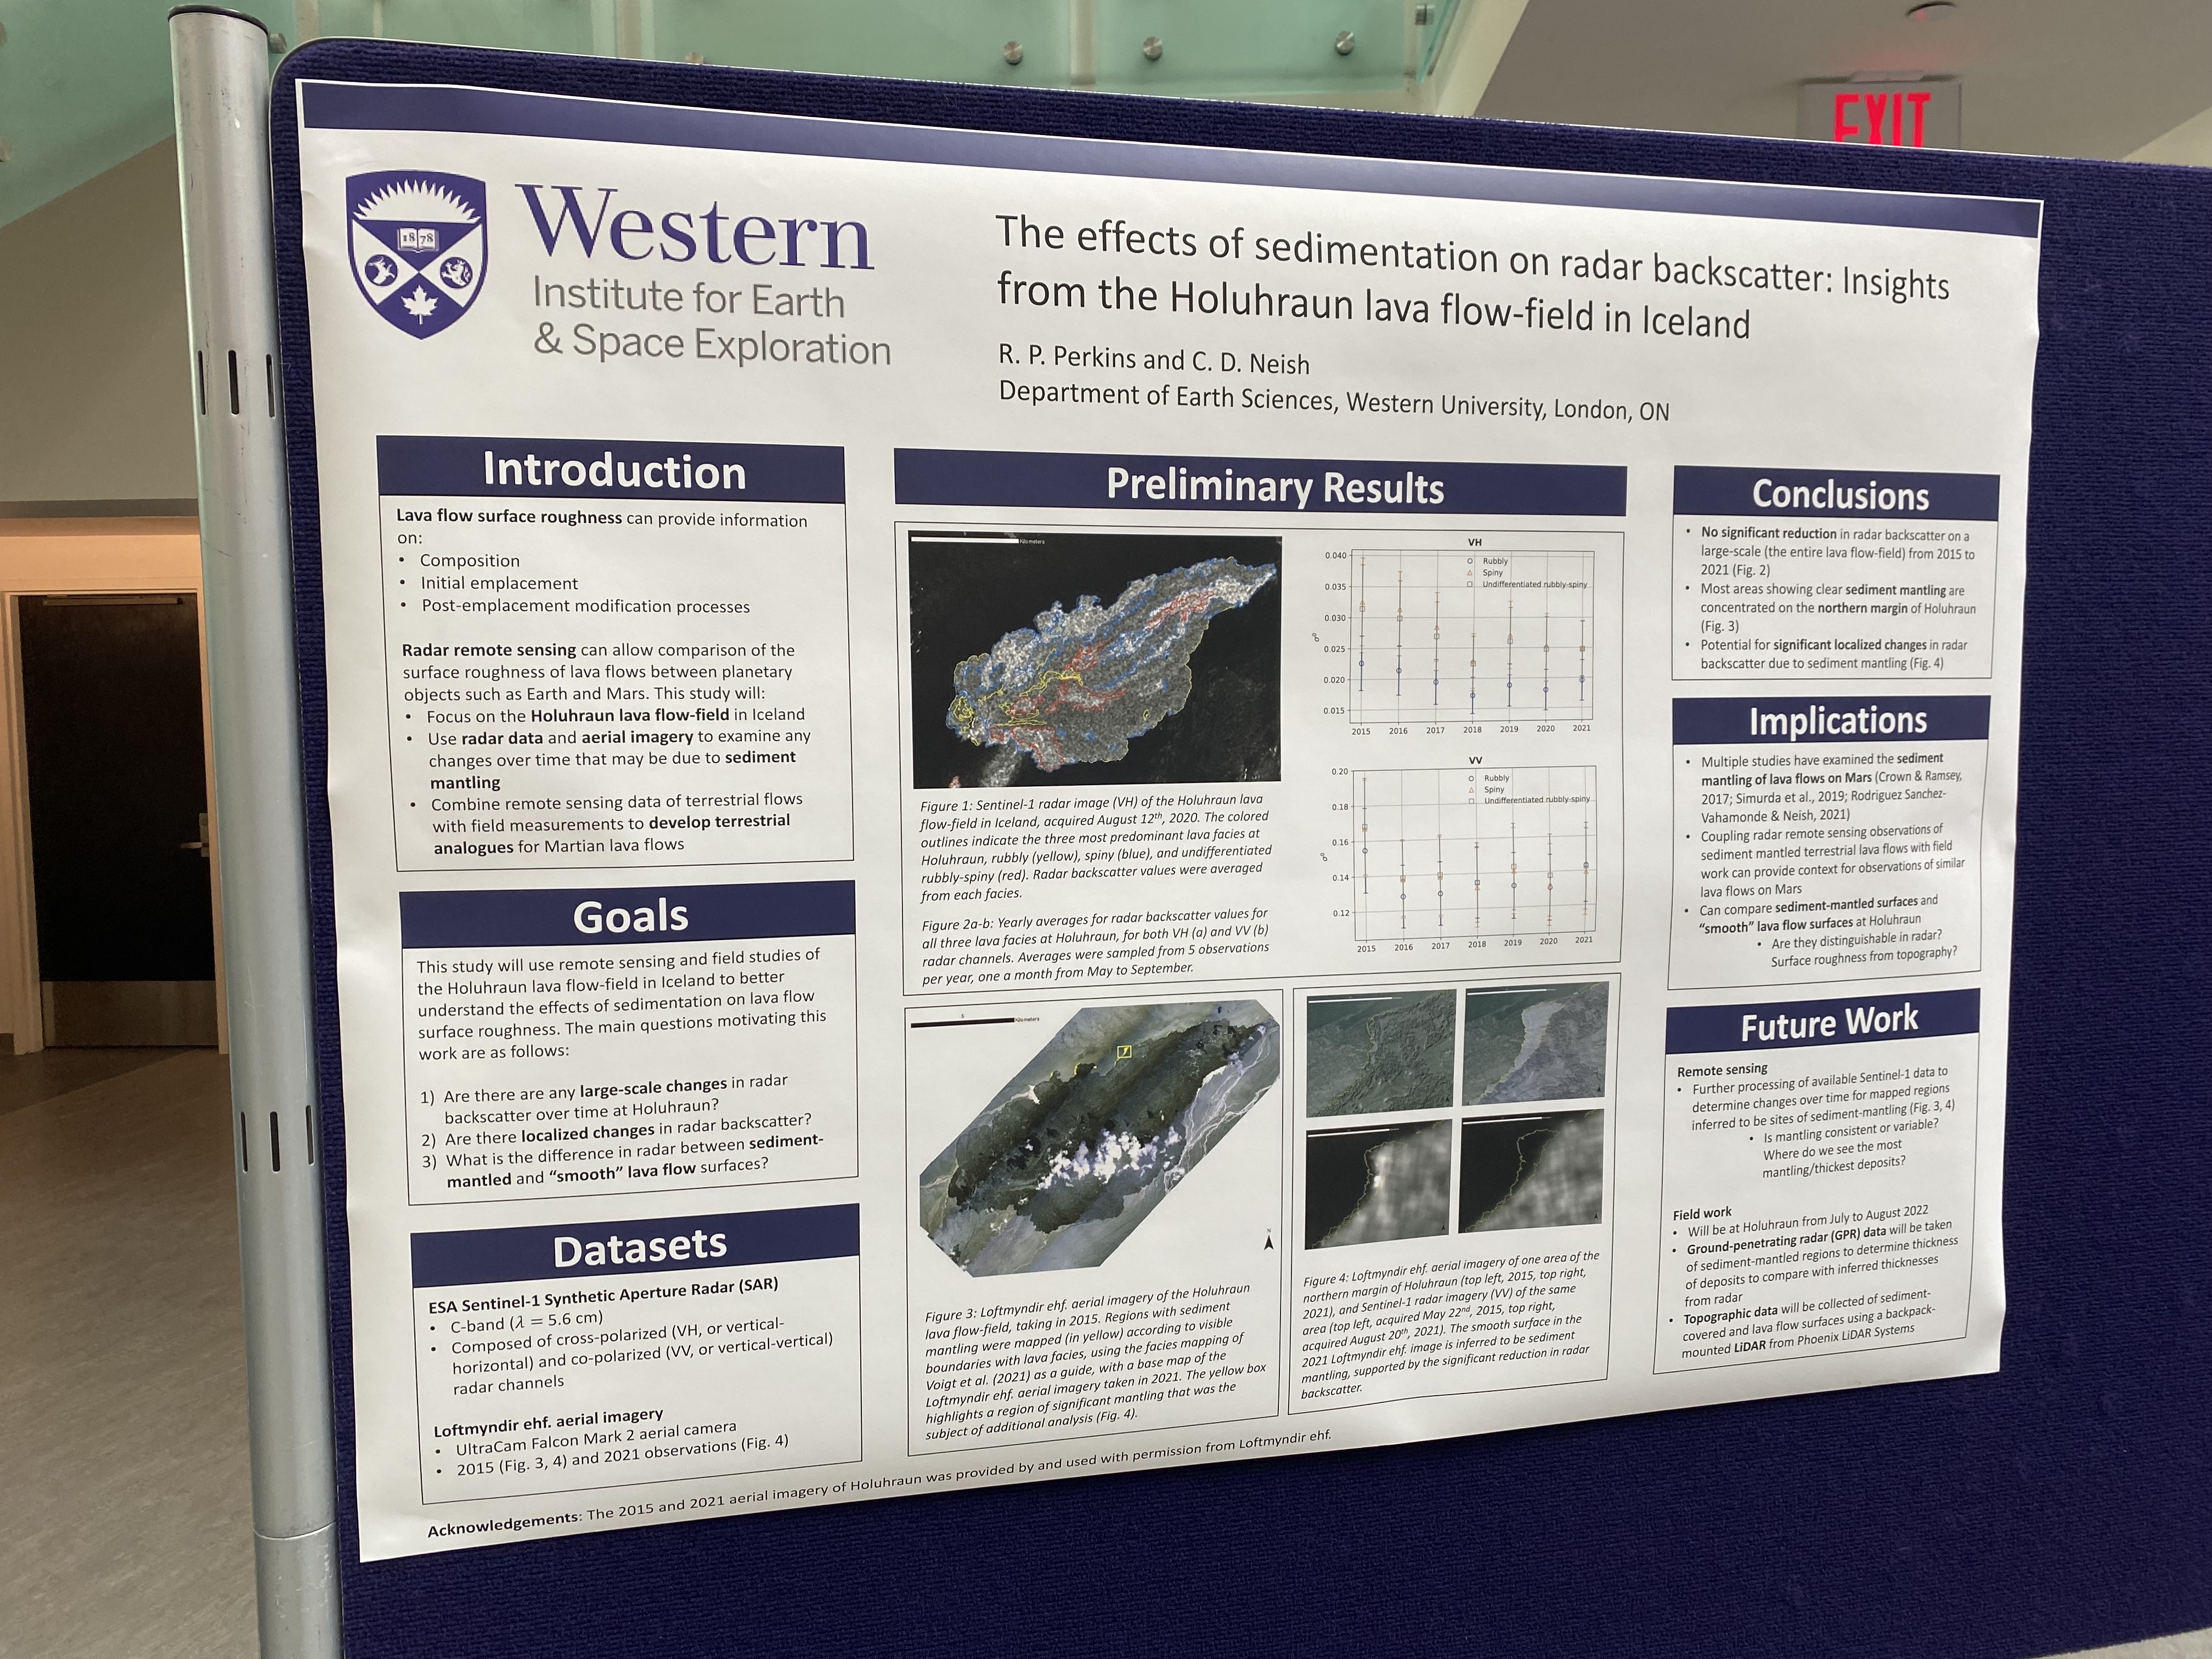
So what have I been working on this past year? In general, the overarching question I'm thinking about is: how does the modification of lava flows on planetary surfaces affect the radar return? To begin to answer this, I'm looking at the Holuhraun lava flow-field in Iceland as an analogue for lava flows elsewhere in the solar system, such as Mars. This is an important issue for remote sensing studies of Martian lava flows-- as sedimentation and dust cover are active processes that modify lava flow surfaces, a better understanding of just *how* these processes affect the radar return for a given surface, as well as how they can be distinguished from different textures (such as "smooth" lava flows) is important for contextualizing radar data from Mars. The same basic parts are there: basaltic fissure-fed lava flows and some source of sediment, whether sand and/or dust. With Holuhraun, we have an exciting window into how a relatively "fresh" lava flow is affected by sedimentation that we don't have with Mars-- Holuhraun finished erupting in early 2015, and we have radar backscatter data from the ESA's Sentinel-1 spacecraft going back from the current year to the end of emplacement. The first analysis to look at the evolution of the Holuhraun lava flow-field in radar was to look at the entire field from 2015 to 2021, divided only by the three major facies (or lava flow textures) mapped at Holuhraun. The first question was this: are there any large-scale changes to the radar backscatter of Holuhraun that may be explained by post-emplacement modification, such as sediment mantling?

So far, I've looked at ~35 Sentinel-1 radar observations of Holuhraun, extracting the radar backscatter values for each facies throughout the lava flow-field. Averaging the results for each year, we find no significant decrease in radar backscatter or difference between the averaged radar backscatter values comparing each of the different facies. This suggests that there is no large-scale reduction in radar backscatter over the entire flow-field in the first six years after emplacement. Noting that she had seen substantial sediment mantling along the margins of Holuhraun the last time she was there, Catherine suggested looking at sections of the flow-field by dividing it up into a few concentric outlines, allowing the average radar backscatter of the margins (where sediment might be more likely to pile up) to be compared to the interior. However, during one of our biweekly meetings Catherine brought up a website operated by an Icelandic company that takes high-resolution aerial photography of various locales in Iceland, including Holuhraun: https://map.is/base/@606307,492389,z7.613333333333335,0
Moving the slider to directly compare the 2015 and 2021 aerial mosaics, we noticed that there's some pretty distinct differences on some of the northern margin of Holuhraun between the two years-- a noticeable smoothing of the rough lava textures seen in the 2021 imagery. With this, I realized that the best way to examine Catherine's hypothesis that the margins of Holuhraun are distinctly affected by sediment mantling would be to map the sediment-mantled regions of Holuhraun directly, then collect the radar backscatter values for those affected regions, comparing it to the rest of the flow-field. While the Loftmyndir ehf. data is not publicly available, a quick email exchange resulted in the company giving permission to use their imagery for academic purposes. Shout-out to Loftmyndir ehf.!
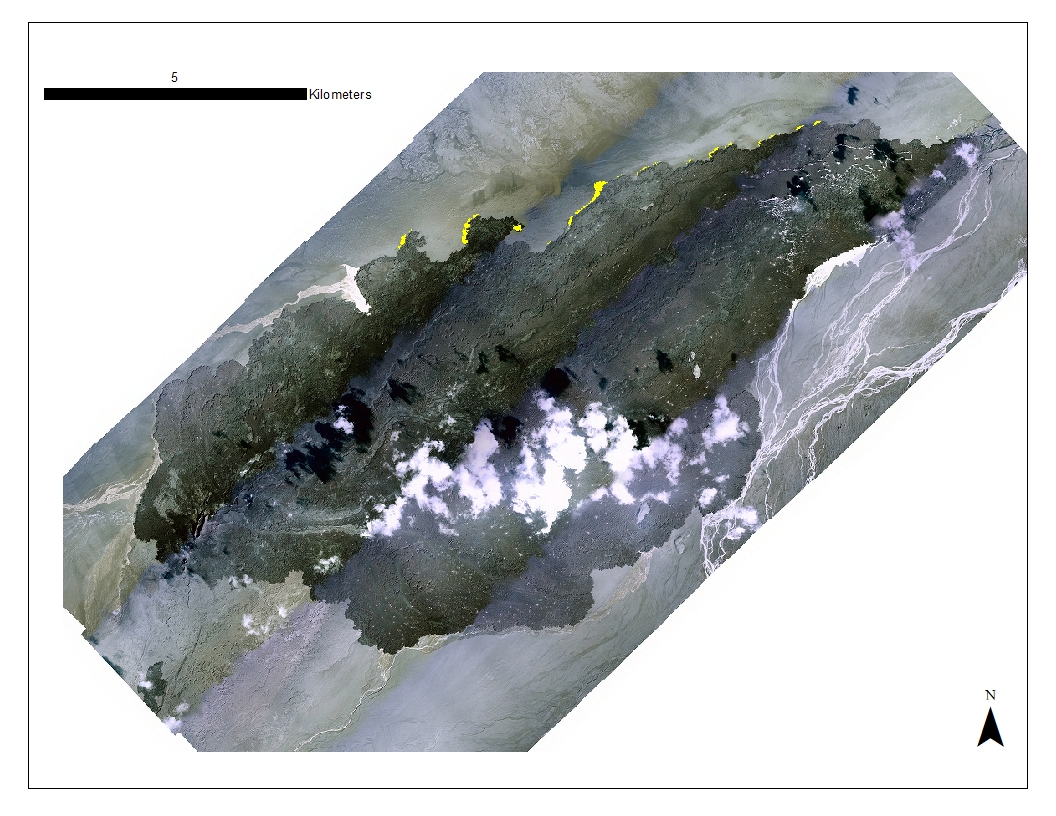
With the aerial imagery from Loftmyndir ehf., I was able to map out the regions in the 2021 imagery where we see a clear difference in surface texture, with many marginal regions of the 2021 imagery showing what appears to be a far smoother surface texture than the rough lava flows visible in the 2015 imagery. Although the differences in texture were clearly visible when comparing the 2015 and 2021 imagery, some judgement was required when deciding where to draw the boundaries of the sediment-mantled regions towards the interior of the flow-field. The assumption we're making is that these smooth regions of the flow are primarily due to mantling by sediment, but that assumption may well be tested by our field work this summer, where we'll hopefully visit a few of these sites to do some ground-truthing. The current phase of analyzing radar data from Holuhraun is looking specifically at the regions that I've mapped out as being mantled by sediment, and seeing how the radar backscatter values change over time for those regions. As an example, below is a figure from my Space Day poster showing aerial imagery and radar data for the same location in 2015 and 2021:
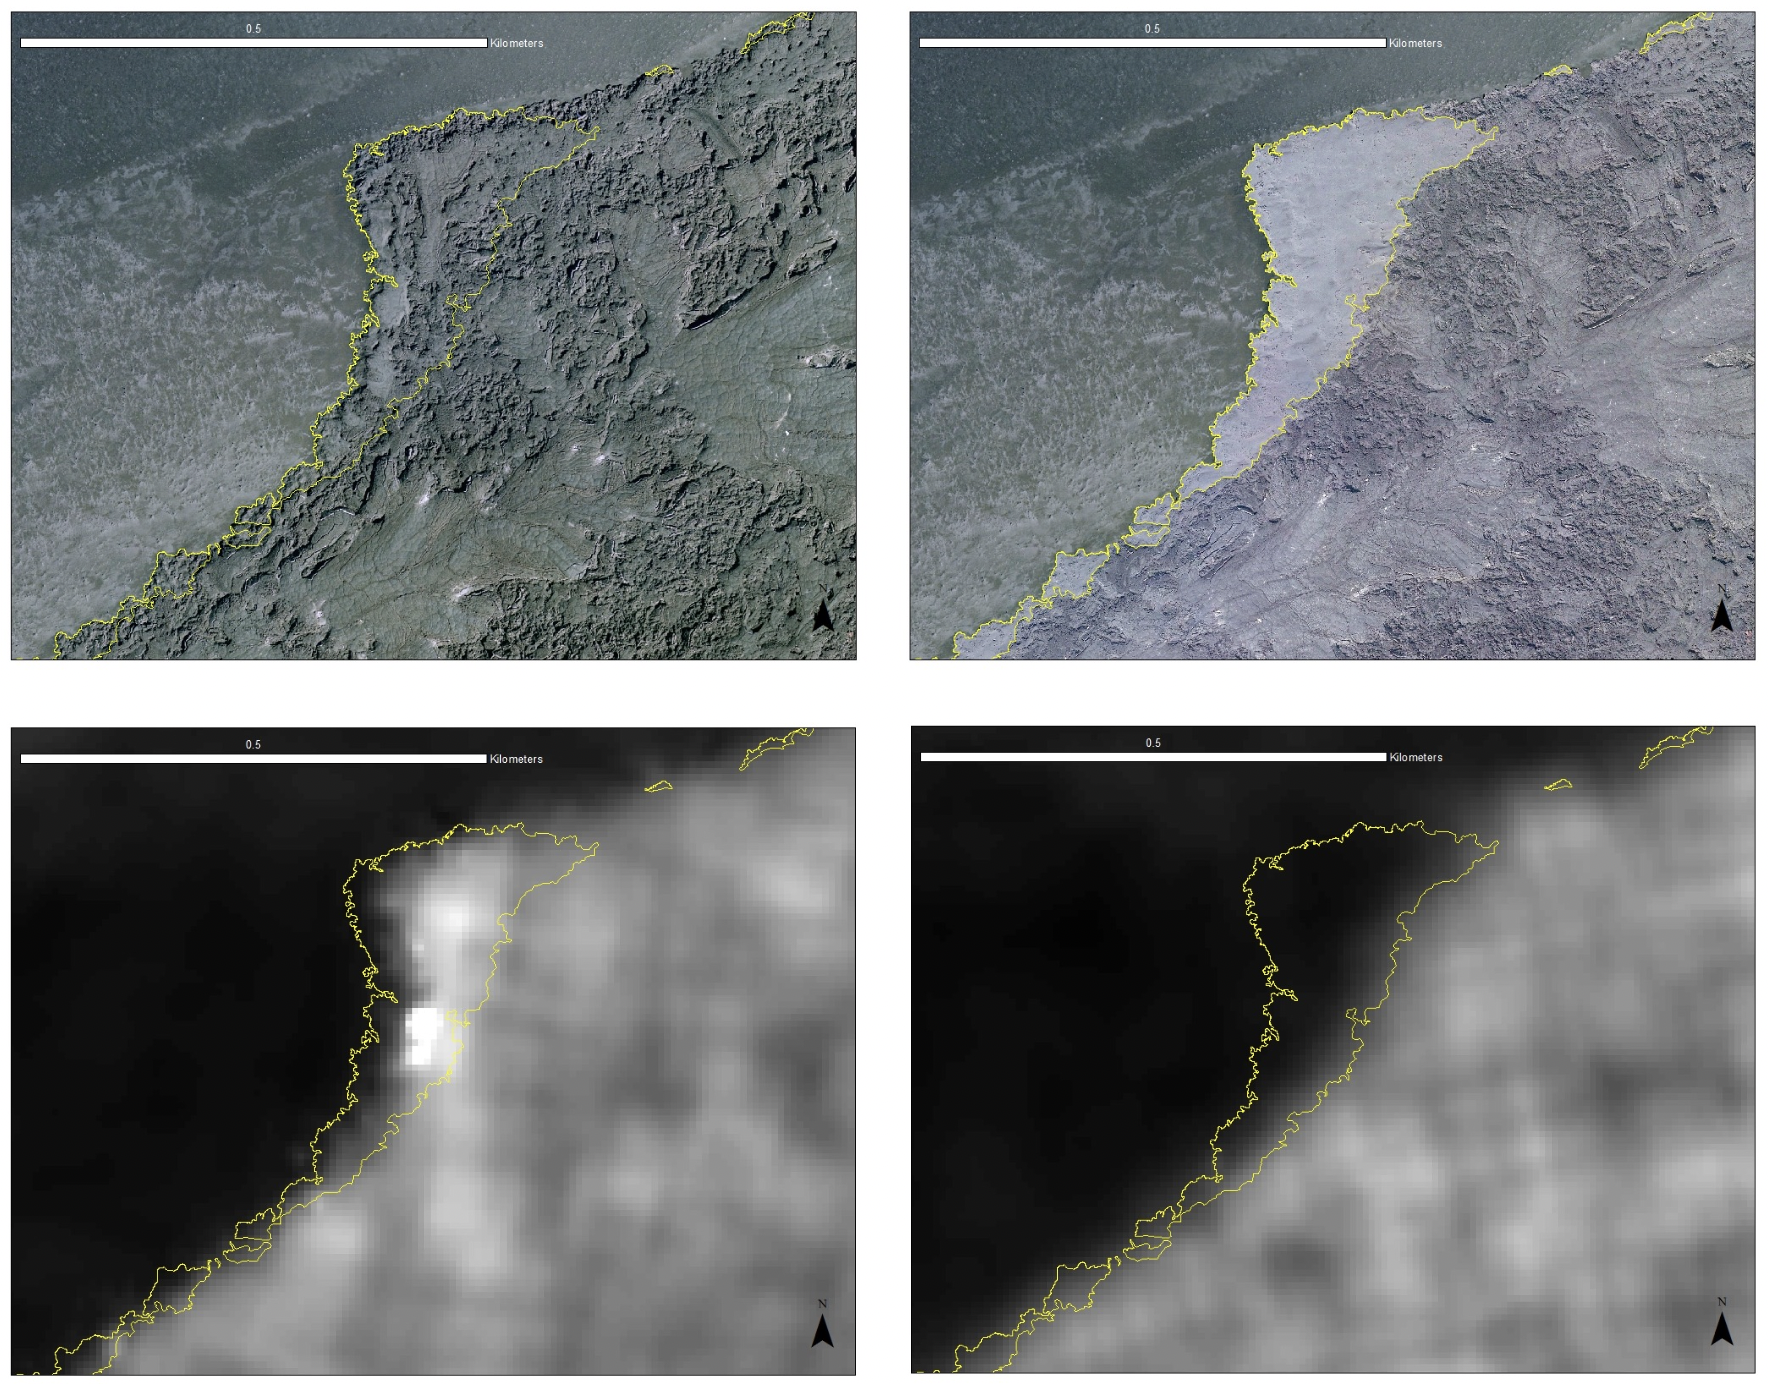
You'll notice that in the 2015 images, the aerial image shows the mapped area to have a similar texture as the rest of the flow, and the radar image shows that the radar brightness is fairly consistent with the area outside the mapped region. However, much changes when you look at the 2021 images: overlaying the 2021 Loftmyndir ehf. image shows a distinctly smooth texture when compared with the rest of the flow outside the mapped region, and we see a substantial decrease in radar brightness. Although I'm just highlighting two observations of one particular region, it does lend support to the hypothesis that enough sediment mantling will cause a significant reduction in radar backscatter. For now, the next phase of the remote sensing aspect of my research focusing on Holuhraun will be to use the same ~35 radar observations to look at the change in radar backscatter both comparing five major "regions" of sediment mantling to each other, as well as the entirety of the mapped sediment-mantled regions as a whole. I think it’ll be interesting to see if there's a distinct difference in the extent to which radar backscatter decreases comparing one region to another, which may provide some guidance for questions that we can answer in the field. One difficulty with this is, as was the case for the data I collected last year, the sheer amount of steps involved with collecting and analyzing the radar data. Essentially, I open up an image in ArcMap, open the mapped region shapefiles, calculate zonal statistics for each shapefile, turn those into a table, turn that table into an Excel sheet, and then manually compile the average radar backscatter and standard deviation into another Excel sheet where I can get a sense of the values over time. If anyone reading this has any tips on how to streamline a ArcGIS/Excel heavy data analysis workflow, please contact me!
As of now, the data we'll be collecting in the field at Holuhraun involves two questions that we'll be ground-truthing: the differences between sediment-mantled and "smooth" lava flows, and the thicknesses of mantled deposits on the margins of Holuhraun. We can augment our remote sensing studies of the differences in radar between sediment-mantled and "smooth" lava flows by producing a DEM of the surface using the backpack LiDAR that I'll be taking out. Do we see differences in topography on the ground that we don't see from inferring roughness from radar remote sensing? Based on the wavelength of radar, we can also calibrate our inferred thicknesses of sediment with measurements taking from ground-penetrating radar (GPR).
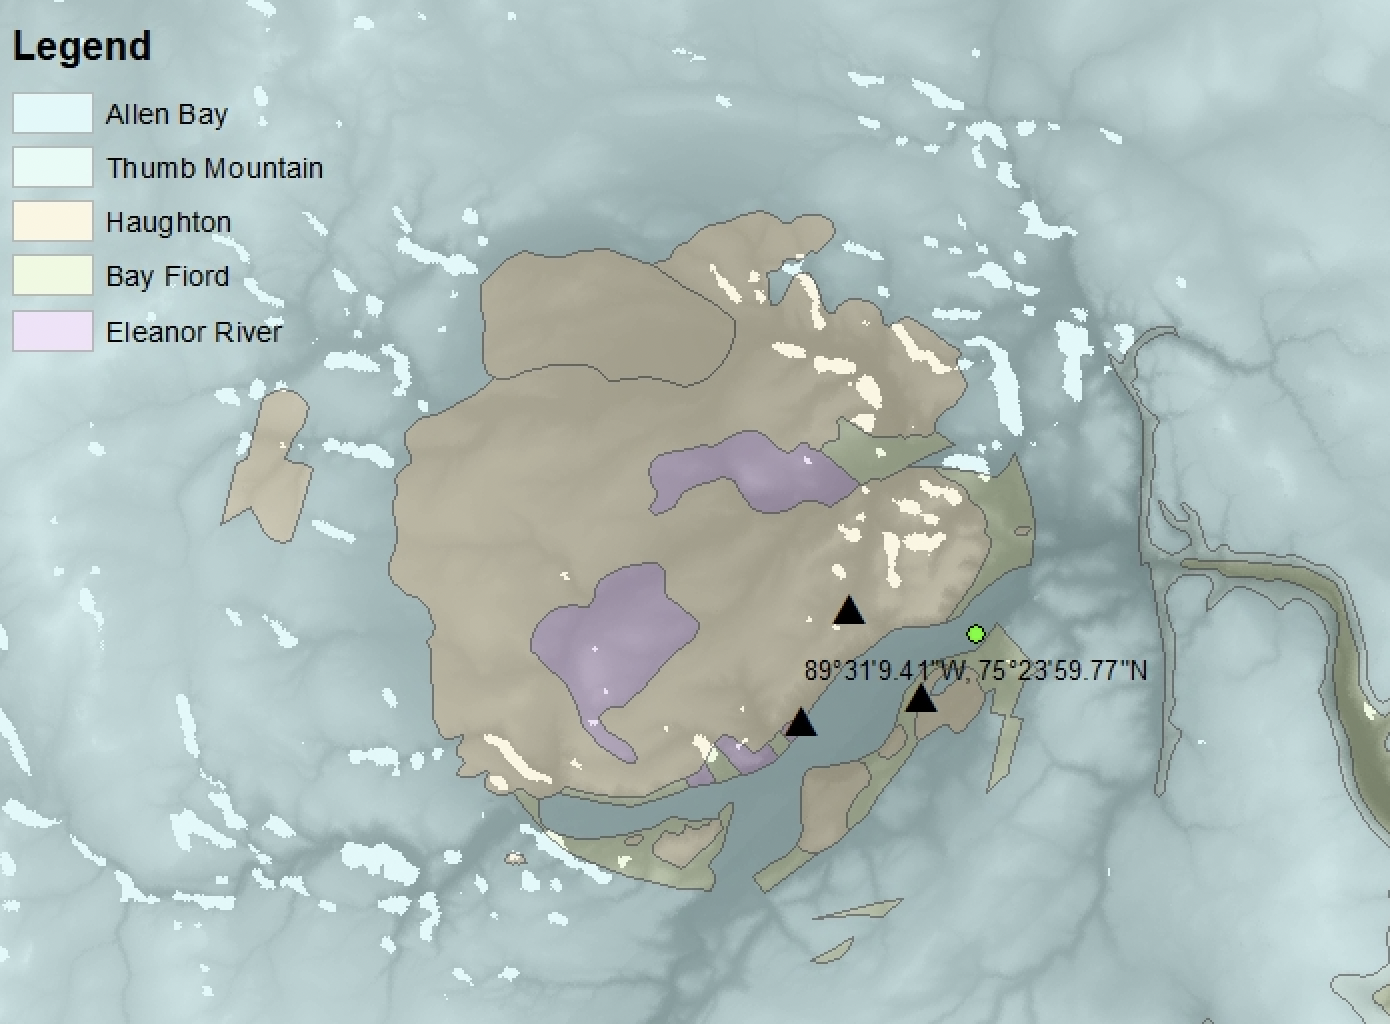
Before I head over to Iceland for field work at Holuhraun, I'll be up in the Canadian Arctic for 2-3 weeks at Haughton crater on Devon Island, working with Dr. Melissa Trainer from NASA GSFC. Dr. Trainer is the Deputy PI for the Dragonfly mission to Saturn's moon Titan as well as the lead for the Dragonfly Mass Spectrometer, which will help us understand more about Titan's surface composition and the potential for prebiotic chemistry. One of the planned sites that Dragonfly will be studying is Selk crater, a heavily degraded crater thought to be dissected by fluvial networks. In this sense, Haughton can be thought of as an analogue to Selk-- obviously, the target composition, gravity, and size are different (Haughton is 23 km in diameter while Selk is around 90 km), but there are similarities in that Haughton has a extensive unit of impact melt breccia cut by rivers, and the impact melt thought to be at Selk may host examples of prebiotic chemistry, potentially made easier to sample by fluvial incision.
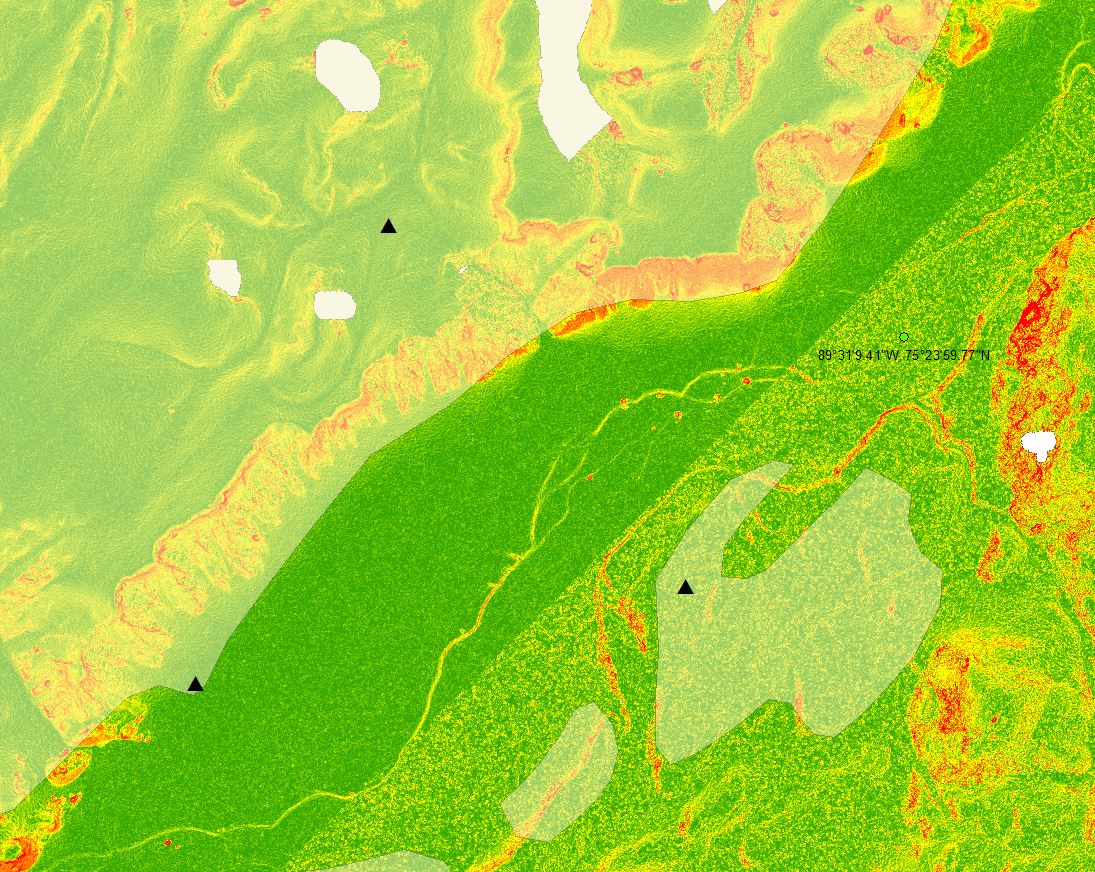
To prepare for field work at Haughton, I selected a few sites that Dr. Trainer and myself may sample for composition and topography-- basically, there are two main metrics by which we want to think about what constitutes a "good" site for Dragonfly to land and sample at Selk: 1) there has to be impact melt (ideally, a contiguous outcrop of impact melt, not isolated cobbles), and 2) it has to be "safe" (not in a cliff or ledge, and smooth enough that Dragonfly can land and sample). Using ArcGIS, I compiled maps of Haughton's surface geology and topography (provided by Dr. Shannon Hibbard) and looked for areas within walking distance of our basecamp that had both mapped outcrops of impact melt and relatively low slopes (less than 10°). I arrived at three sites that appear suitable upon initial analysis, but between now and when we're in the field these are subject to change.
Well, this is where I'm at now! As Smash Mouth said in their hit song "All Star," there's "so much to do, so much to see."