To start off, let's go on a tangent and talk about the planet Venus. You know Venus. You love Venus. Venus is great! Very hot, very dense atmosphere. Beneath that dense atmosphere are some rocks. If you're like me, you're very interested in what kind of rocks they are. What composition are they? Are they like granites, slowly crystallizing underneath the Earth's crust, or are they like basalts, becoming (figuratively) flash-frozen in a geological second upon intruding through the Earth's crust via a fissure or some other volcanic source? Well, all that atmosphere creates problems if you're thinking of orbiting a standard visible light camera around Venus, imaging the planet using the same wavelengths that our eyes are used to. How do you get through all that atmosphere? You have to use other wavelengths of light that can penetrate through the cloud cover. That's where radio waves come in, having a longer wavelength that is able to pass through water vapor (or carbon dioxide gas) molecules in a way that visible light cannot. In 1961, scientists at the Jet Propulsion Laboratory beamed a radio signal at Venus, detecting the "return echo" of the radio wave within minutes.
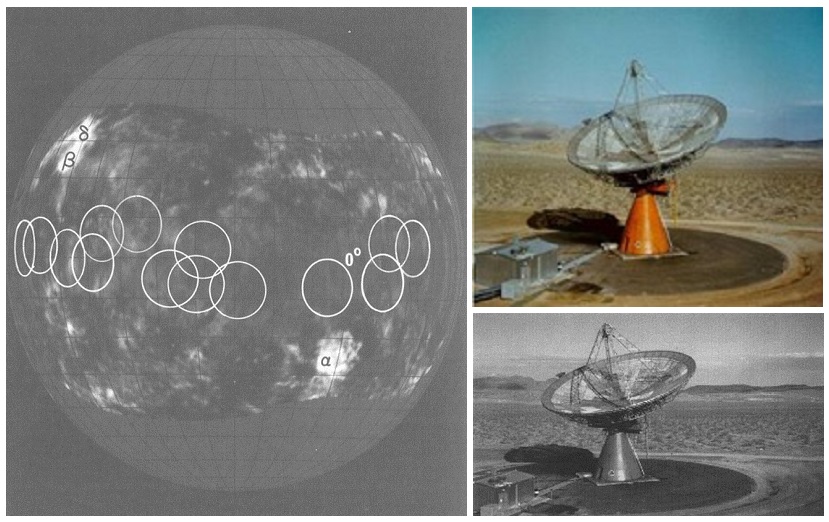
Over the years, the imaging of targets using radio waves (better known as radar) become more and more sophisticated, allowing us to peer through dense cloud cover to obtain higher-resolution data of planetary bodies like Venus and Saturn's moon Titan. In addition to allowing data to be collected from targets opaque to visible light imaging, radar also provides much information on the surface properties of the target. It is this area in which my initial research here at Western is concerned.
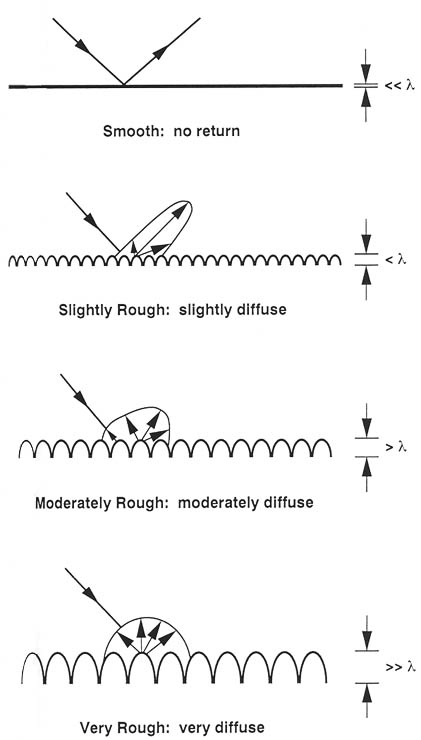
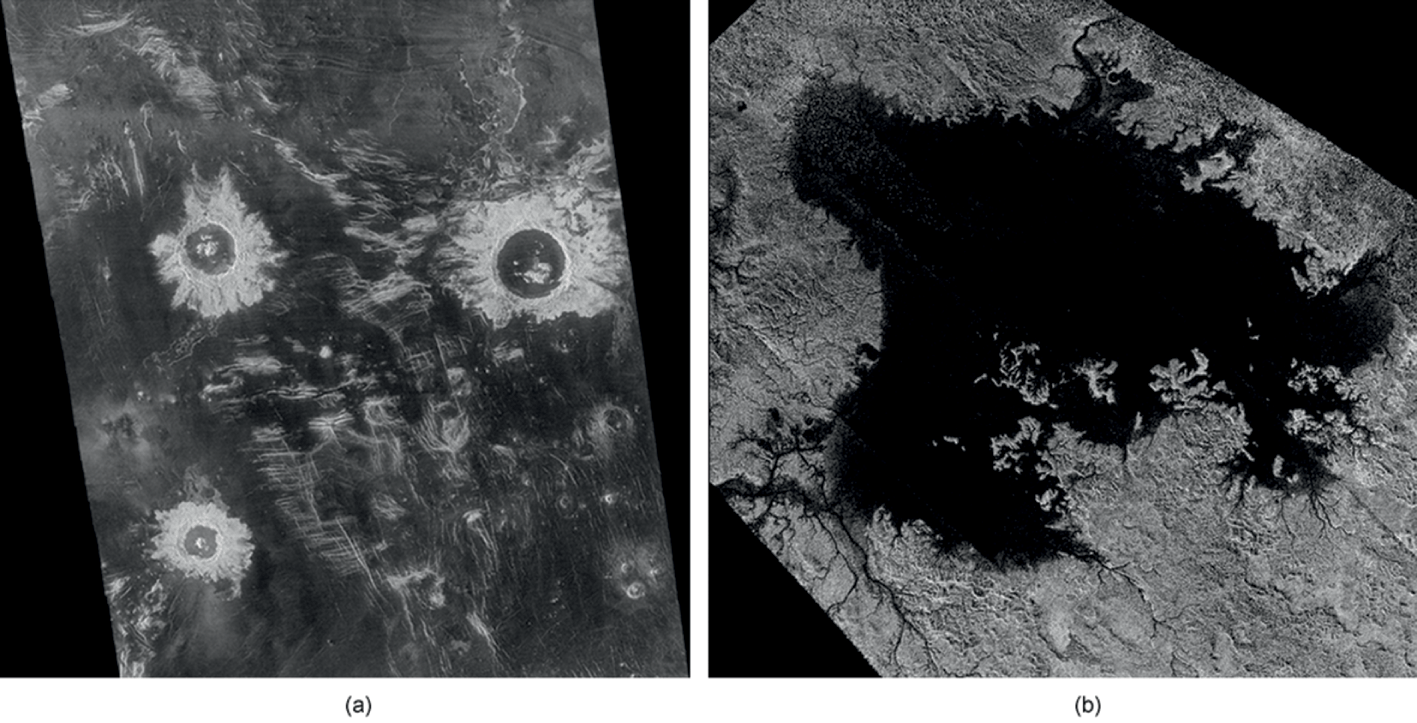
When a radar wave is emitted from a sensor, the amount of energy that ends up being reflected back (also known as the "backscatter") can tell you much about the target surface. One of the key constraints on radar backscatter is the roughness of the surface relative to the wavelength of the radar sensor. For a given radar wavelength, the surface will appear radar-dark if the variation in surface heights is smaller than the radar wavelength, while the surface will appear radar-bright when the variation in surface heights approaches the scale of the radar wavelength.
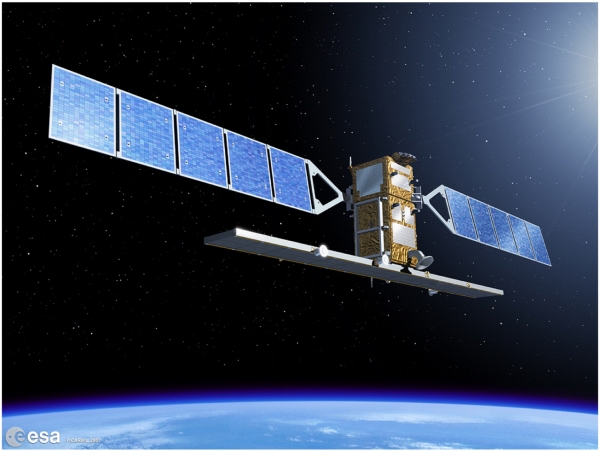
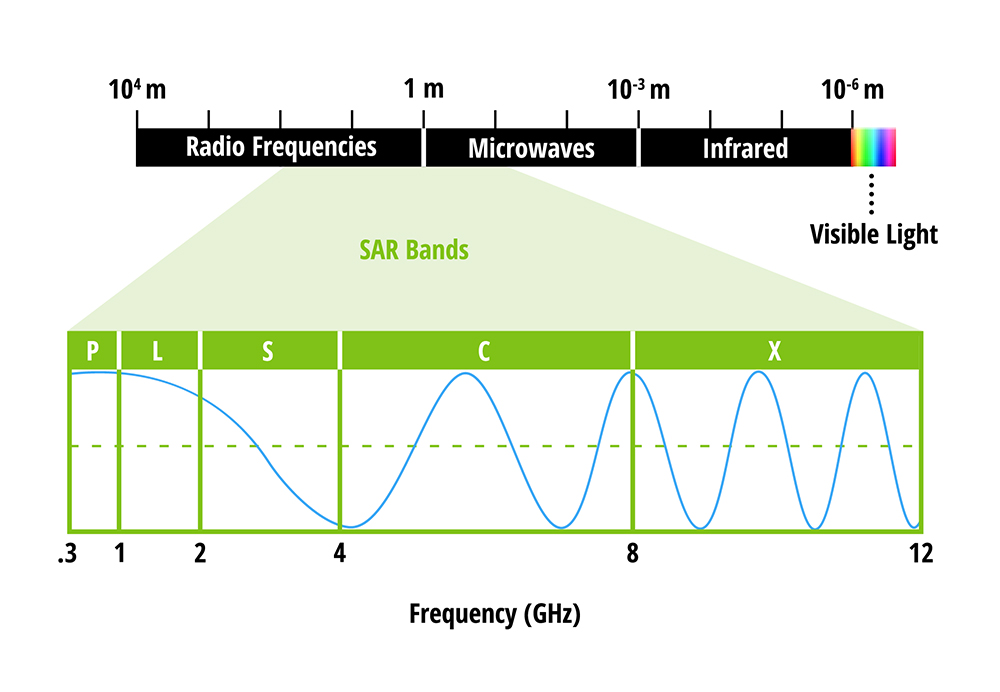
For my research, I'll be examining variations in surface roughness in lava flow-fields both on Earth and elsewhere in our solar system. One of my study areas is the Holuhraun flow-field in Iceland, notably the site of a recent fissure eruption, lasting from August 2014 to February 2015. This area has been imaged regularly by the Sentinel-1 mission, a constellation of two satellites operated by the European Space Agency (ESA). Both satellites carry a C-band Synthetic Aperture Radar (SAR) instrument, meaning that the radar wavelength is from 3.75 to 7.5 cm. But what exactly is synthetic about SAR? It has to do with the spatial resolution of radar data, which itself is directly connected to the ratio of the radar wavelength to the length of the sensor antenna. Basically, to get a spatial resolution of around 10 m, you would have to have an antenna length far greater than what can realistically be mounted onto a satellite. So, the solution is to "simulate" a larger antenna length by using a sequence of acquisitions from a shorter antenna. SAR instruments have been used for obtaining radar data of thickly-clouded worlds like Venus and Titan, as well as investigating the possible presence of surface ice on the Moon.
If you read this far, thanks for sticking around! This was a casual and gentle introduction, but I hope to more deeply explore the instruments and data that I'll be using in future blog posts. And hopefully with a website that doesn't look like it dates back to the second Clinton term (or the term of Jean Chrétien for any Canadian readers). Until then!